The complexity of urban areas, with their diverse building types and structures, makes damage classification particularly challenging. Satellite images provide a broad overview of the affected areas, but their accuracy often requires validation through ground-truth data, such as field surveys. While satellite imagery can be valuable, it alone may not offer the level of precision needed for detailed damage detection. This suggests that combining satellite imagery with other data products might provide a more robust solution.
Recently, satellite embeddings have gained traction in various geospatial workflows. For a more detailed discussion on their potential and limitations, see my article here.
In this short piece, we take an experimental approach to explore how satellite embeddings can be used to detect building damage
The Hypothesis:
Satellite embedding similarity between two different time points can help identify building damage.
The experiment: For this experiment, I conduct a similarity analysis, similar to the one introduced in the blog here, But for two different years. The output of this analysis is the similarity layer produced by subtracting the dot products of two different embedding layers from two different year.
The Experiment:
In this experiment, I performed a similarity analysis, similar to the method introduced in Google’s blog post here, but using data from two different years. The output of this analysis is a similarity layer, generated by subtracting the dot products of two embedding layers from two different time periods. The goal is to detect changes in the condition of buildings between those two time points.
To identify damaged buildings, a threshold for similarity scores needs to be determined. For this, I used building damage data from OpenStreetMap (OSM) to calculate the average “similarity score” for damaged buildings and then used that as the threshold for detecting damage.
The Results:
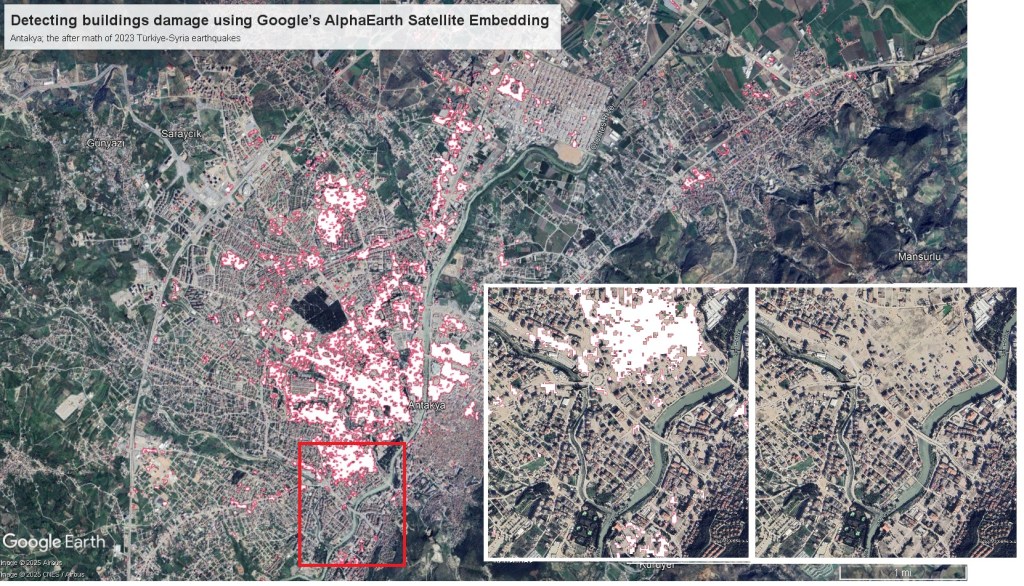
The results were promising. A visual inspection of the detected damage, compared with a sample of buildings labeled as damaged in OSM, shows that embedding similarity can indeed be used effectively for this task. The method clearly identifies areas with significant damage, providing a promising approach for automatic damage detection in disaster zones.
Interestingly, when I combined the two-year vector embeddings to create a long vector representing both statuses (pre- and post-event), the results weren’t as helpful. This is likely because of the diplomatic approach of the dot product differencing that I followed. It would definitely be interesting to explore these combinations using a different method.
However, it’s important to note that the temporal aspect is crucial in disaster scenarios. The analysis here reflects the change between two years, highlighting the before-and-after condition of buildings.
The time stamps remain one of the most critical challenges to explore Embeddings for real-world applications. For more on the role of timestamps in satellite embeddings, refer to my article on the topic here.
The experiment shows that satellite embeddings, when used to analyze the temporal changes in building conditions, can be a useful tool for detecting damage after disasters like earthquakes.
#GeoAI #EarthObservation #DamageDetection #ChangeDetection #EarthAI #GeoEmbeddings #AI4EO #GEOINT #PhysicalAI #RemoteSensing

Leave a comment